5 Measurement and Analysis of Rainfall
Measurement and Analysis of Rainfall
Rainfall measurement is crucial for water resource management, hydrological studies, and climate analysis. The process involves using rain gauges to collect precipitation data and employing various statistical and spatial methods to analyze the recorded rainfall.
1. Non-Recording Rain Gauges
Non-recording rain gauges measure the total rainfall over a specific period but do not provide continuous records of rainfall intensity or variations. The collected water is manually measured at regular intervals.
(a) Symon’s Rain Gauge
- Standard non-recording rain gauge used in India.
- Consists of a circular collector (127 mm diameter) that directs rainwater into a receiving bottle through a funnel.
- Collected rainfall is measured using a graduated measuring jar.
- Readings are taken once or twice a day.


- Similar to Symon’s gauge but with specific modifications as per IMD standards.
- The body is made of fiber-reinforced plastic (FRP) or brass to prevent corrosion.
- Standard height of installation is 30 cm above ground level.
- Used extensively across India for official rainfall data collection.
2. Recording Rain Gauges
Recording rain gauges provide a continuous record of rainfall intensity and variation over time. These are essential for detailed hydrological studies.
(a) Floating Bucket Rain Gauge
- Uses a float mechanism inside a cylindrical container to measure rainfall.
- As rainwater accumulates, the float rises, moving a pen on a rotating drum to record the rainfall depth.
- Provides a continuous graphical record of rainfall over time.
- Used in synoptic meteorology and flood forecasting.


(b) Tipping Bucket Rain Gauge
- Consists of a funnel that directs rainwater into a small, balanced bucket mounted on a pivot.
- When the bucket fills to a preset volume (e.g., 0.2 mm or 0.5 mm of rainfall), it tips over and empties.
- Each tip generates an electrical signal that is recorded, allowing for automatic measurement of rainfall intensity.
- Commonly used in automated weather stations.


https://www.youtube.com/watch?v=qzKWzTe7CEg

(c) Weghing Type Rain Gauge
- Uses a weighing mechanism to measure accumulated rainfall.
- The collected rainwater is stored in a bucket placed on a spring balance or load cell.
- The weight of the water is continuously recorded on a chart or electronic device.
- Provides highly accurate readings and is used in meteorological research.
Measuring Rainfall: A Comprehensive Guide
Accurate rainfall measurement is crucial for various applications, from agriculture to weather forecasting. This blog post details the process, from the instruments used to proper installation and maintenance.
1. The Rain Gauge: Your Rainfall Measurement Tool
- What it is: A rain gauge is the standard instrument used to measure rainfall at a specific location.
- WMO Standards: The World Meteorological Organization (WMO) recommends Fiberglass Reinforced Polyester (FRP) rain gauges as the standard instrument for all rain gauge stations.
- Key Components: A rain gauge consists of:
- Collector: A circular gunmetal rim (100 or 200 sq. cm. area) that captures the falling rain.
- Base: Supports the collector and houses the collection bottle.
- Collection Bottle: A polythene bottle that stores the collected rainwater.
- Measuring Glass: A graduated glass used to measure the amount of collected water.
- Design and Materials:
- Both the collector and base are made of FRP.
- The collector has a deep-set funnel, and the entire rain gauge tapers towards the top.
- Collectors with 100 and 200 sq. cm. apertures are interchangeable.
- 100 sq. cm. collector diameter: 112.9 mm.
- 200 sq. cm. collector diameter: 159.6 mm.
- Two types of interchangeable bases exist; the smaller base is used for all receiver types except the largest.
- How it Works: Rainwater collected by the funnel flows into the bottle inside the base. The collected water is then measured using a specialized measuring glass calibrated in tenths of a millimeter, typically with a 20 mm capacity.
- Collector: A circular gunmetal rim (100 or 200 sq. cm. area) that captures the falling rain.
- Base: Supports the collector and houses the collection bottle.
- Collection Bottle: A polythene bottle that stores the collected rainwater.
- Measuring Glass: A graduated glass used to measure the amount of collected water.
- Both the collector and base are made of FRP.
- The collector has a deep-set funnel, and the entire rain gauge tapers towards the top.
- Collectors with 100 and 200 sq. cm. apertures are interchangeable.
- 100 sq. cm. collector diameter: 112.9 mm.
- 200 sq. cm. collector diameter: 159.6 mm.
- Two types of interchangeable bases exist; the smaller base is used for all receiver types except the largest.
2. Rain Gauge Exposure: Location Matters
- Site Selection: The amount of precipitation collected is significantly influenced by the rain gauge's exposure. Careful site selection is essential.
- Ideal Location:
- Level ground, away from trees, buildings, and other obstructions.
- Avoid slopes or terraces.
- The distance between the rain gauge and any obstacle should ideally be four times the obstacle's height.
- The minimum distance should be no less than twice the object's height above the gauge rim.
- A position sheltered from wind is preferable to an exposed one, provided the other criteria are met.
- Uniformity: To ensure comparable observations across different stations, exposure should be as uniform as possible.
- Height: The rim of the rain gauge should be exactly horizontal and maintained at a height of 30 cm above ground level.
- Thermometer Screen Proximity: The rain gauge should be positioned 3.6 meters south of the thermometer screen.
- Level ground, away from trees, buildings, and other obstructions.
- Avoid slopes or terraces.
- The distance between the rain gauge and any obstacle should ideally be four times the obstacle's height.
- The minimum distance should be no less than twice the object's height above the gauge rim.
- A position sheltered from wind is preferable to an exposed one, provided the other criteria are met.
3. Rain Gauge Installation: Setting it Up Correctly
- Foundation: The rain gauge should be fixed on a 60x60x60 cm concrete foundation sunk into the ground.
- Embedding: The base of the gauge should be embedded in the foundation, ensuring the rim is precisely 30 cm above the surrounding ground level.
- Height Significance: This height prevents excessive rain splash from the ground into the gauge. Deviating from this height can affect readings; exceeding it may require corrections due to wind eddies.
- Leveling: The rim of the gauge must be perfectly level, checked using a spirit level.
4. Care and Maintenance: Keeping Your Gauge in Top Condition
- Cleanliness:
- Ensure the collector is free from dirt.
- Keep the receiving bottle and any additional cylinders clean, regularly emptying them of sediment and other debris.
- Wipe the outer surface of the rain gauge with a damp cloth.
- Do not paint the rain gauge.
- Leak Checks: Regularly inspect the collector, receiving bottle, and base for leaks. Repair or replace leaking components.
- Collector Attachment: When replacing the collector, ensure the two locking rings are properly engaged. Handle these rings with care.
- Rim Protection: Avoid denting or deforming the gunmetal rim.
- Security: Keep the rain gauge locked when not in use.
- Vegetation Control: Keep the grass around the gauge short and remove any shrubs or plants growing nearby.
- Measuring Glass Care:
- Keep both measuring glasses spotlessly clean.
- Handle them gently to prevent breakage.
- Store them dry in a safe place when not in use.
- Wipe them dry before placing them in the thermometer screen after use, especially in freezing weather to prevent them from sticking.
By following these guidelines for installation, exposure, and maintenance, you can ensure accurate and reliable rainfall measurements for your specific needs.
2. Methods of Calculating Average Rainfall
To analyze rainfall over a region, it is essential to determine the average rainfall based on data from multiple rain gauge stations. The three commonly used methods for calculating average rainfall are:
2.1. Arithmetic Mean Method
Principle:
- This is the simplest method, where the average rainfall is calculated by taking the arithmetic mean of rainfall values recorded at different rain gauge stations.
Formula:
where,
= Average rainfall over the area (mm),
= Rainfall recorded at the station,
= Total number of rain gauge stations.
Advantages:
✔ Easy to apply when rainfall is uniformly distributed.
✔ Requires minimal data processing.
Limitations:
✖ Not suitable for regions with uneven spatial distribution of rainfall.
✖ Does not consider the relative influence of each rain gauge station on the area.

2.2. Thiessen Polygon Method


Principle:
- This method assigns weights to rainfall data based on the area of influence of each rain gauge station.
- The area is divided into polygons using perpendicular bisectors between adjacent stations.
Procedure:
- Plot the locations of rain gauge stations on a map.
- Connect neighboring stations with straight lines.
- Draw perpendicular bisectors to form Thiessen polygons around each station.
- Measure the area of each polygon and calculate the weighted average rainfall.
Formula:
where,
= Rainfall recorded at the station,
= Area of the Thiessen polygon for the station,
= Total area of the region.
Advantages:
✔ More accurate than the arithmetic mean method as it considers the influence area of each rain gauge.
✔ Useful for moderately variable rainfall distribution.
Limitations:
✖ Requires mapping and area measurement, making it more complex.
✖ Does not account for variations within each polygon.
How to Draw Thiessen Polygons?
In simple words, Thiessen polygons are polygons of different sizes and shapes adjacent to each other drawn around a focal point with the help of geometry. Let us take an example of a catchment area interspersed with many weather stations (see black dots in Fig.1). This exercise is to determine the area of influence under each weather station using Thiessen polygon method.
- Firstly, join all the adjacent dots in the region to form the triangles of various shapes and sizes (see maroon lines in Fig.1). Please remember that one has to join the nearest adjacent dots only. Sometimes, a case arises where we get a quadrilateral. In that case, we should not draw diagonals in that quadrilateral to form four triangles. We have to draw one diagonal which is shorter (Fig.2). In Fig. 2, see points A, B, C and D. We have connected them to form a quadrilateral but we have drawn the shorter diagonal BD to form triangles instead of AC. Similar is the case of quadrilateral ADFE. In this manner we get triangulation of area which fulfils Delaunay Criterion.
- Given a set of arbitrarily distributed data points, there are many ways to organize them in a triangular mesh. But not all possible triangle meshes provide a favorable representation of the spatial relationships between points. How do we decide which vertices to connect in such a way as to obtain an optimal structure? A Delaunay mesh-building process makes that decision based on a principle known as "the Delaunay criterion". The Delaunay criterion specifies a rule for using geometric considerations to determine whether a pair of neighboring triangles represents an optimal choice of connections. When a pair fails to meet the criterion, the connections are reorganized so that they are "Delaunay conformant". The process continues until all triangles in the mesh meet the Delaunay criterion. In the end, the process creates a mesh that has a number of attractive and useful features and is optimal in many regards.
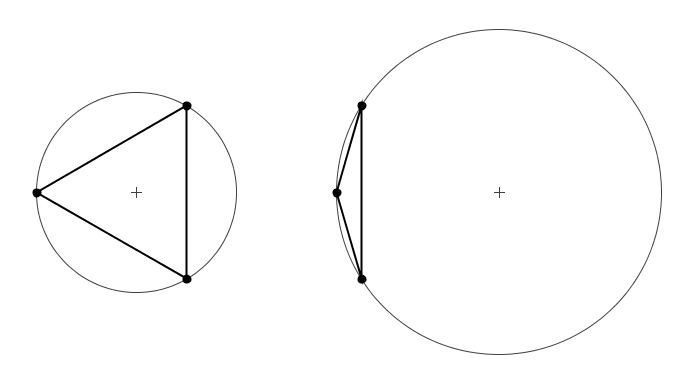
- To illustrate this idea, the figure below shows an example of what happens when a set of points is connected in an arbitrary manner versus one that conforms to the Delaunay criterion.

- To many people, the arrangement on the right appears more pleasing than the one on the left. The image on the right is an example of a Delaunay Triangulation. In addition to its aesthetic appeal, the Delaunay has a number of favorable properties that were demonstrated by Boris Delaunay in 1934 and other researchers since.
- Understanding the Delaunay criterion
- It is perfectly fine to use software tools based on the Delaunay Triangulation without being overly concerned about the nature of the underlying Delaunay criterion. But, for those who are interested, let's take a look at the principles at the foundation of the technique.
- The Circumcircle
- From a proof in geometry, we know that three non-collinear points, such as those that compose a triangle, define a unique circle. Thus each triangle in a TIN is associated with a figure called the circumcircle. Two examples of triangles with corresponding circumcircles are shown in the figure below.
- From the figure, a few characteristics of the circumcircle are immediately apparent:
- As its name implies, the circumcircle entirely encloses its associated triangle
- Skinny triangles produce larger circumcircles than robust triangles of a similar size.
- In skinny triangles, the portion of the area of the circle not covered by the triangle is proportionally larger than it is for robust triangles.
- The center of a circumcircle does not necessarily lie in the interior of the associated triangle. So the region encompassed by a large circumcircle may extend far beyond the region defined by its associated triangle.
- With those characteristics in mind, we will see that circumcircles play a key role in the definition of the Delaunay criterion. Specifically, a triangulation is "Delaunay optimal" if and only if the following conditions are met:
- All triangles formed by the mesh are non-degenerate. That is, no set of three collinear points is linked together into a single triangle. Such a triangle would have a zero area and a resulting circumcirle of infinite radius.
- All triangles in the mesh produce a circumcircle which does not contain any other vertices from the mesh except for the three vertices that define the triangle.
- The second item is the key to the Delaunay Triangulation. Consider the figure below which shows triangle with vertices A, B, and C, with vertex D lying outside the circumcircle of Triangle ABC. If we link together vertices to add triangle CBD, the resulting network will be optimal from the perspective of the Delaunay criterion.
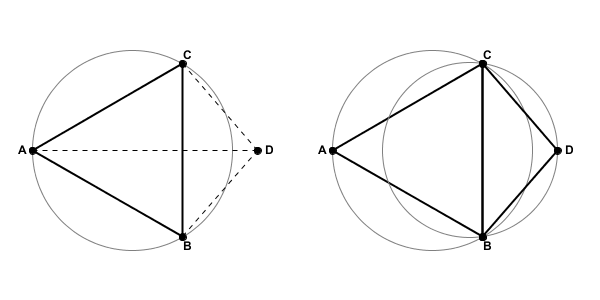
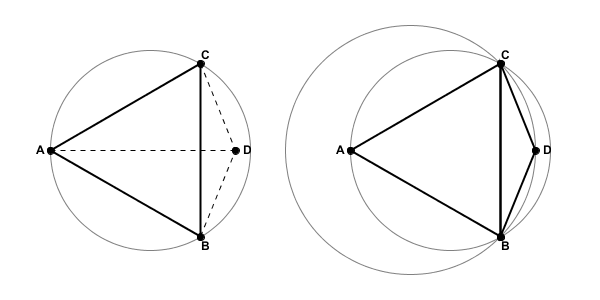
- If, however, we were to position vertex D so that it was inside the circumcircle of Triangle ABC, the resulting triangulated network would not be Delaunay optimal. As the figure below illustrates, not only would vertex D be inside the circumcircle for ABC, but vertex A would be inside the circumcircle for triangle CBD.
- Restoring Delaunay Optimality
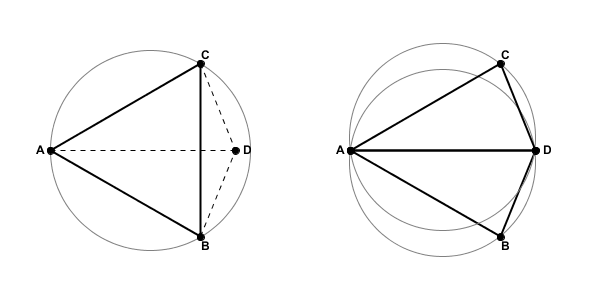
- So how can we correct the network to restore Delaunay Optimality? In the figure above, the edge CB seems to be the source of the problem. What if we were to break the link between vertices C and B and instead create an edge from A to D? As the figure below shows, Delaunay optimality is restored. Vertex C does not fall with the circumcircle of triangle ABD nor does vertex B fall with the circumcircle of triangle CAD.
- The operation that switches the common edge between two adjacent triangles is sometimes called a "flip". The earliest Delaunay Triangulation algorithms were all based on using flip operations (see Lawson 1977). Since then, more sophisticated approaches have been developed (see Su 1996).
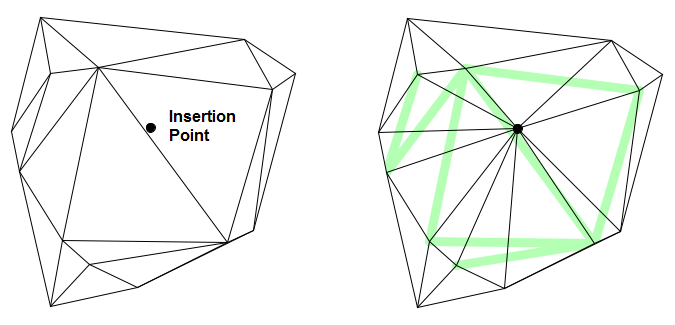
- When a vertex is inserted into a TIN, there is nothing preventing it from falling into more than one circumcircle. In such cases, more than one edge may require flipping. An example of a case where a single insertion requires multiple edge modifications is provided below. The image on the left shows the original TIN before the insertion point was added to the structure. The image on the right shows the resulting network with both additional and modified edges. The light green line segments in the image show where edges from the original structure were flipped to create the new structure.
- The Delaunay Triangulation provides the foundation for the Tinfour software library and many other software packages that perform surface analysis applications. In this paper we briefly considered some of the underlying ideas of the Delaunay Triangulation and gave a high-level view of how it is specified. A complete discussion of the uses and extensions of the Delaunay Triangulation is beyond the scope of this wiki. If you are interested in learning more, I encourage you to search the web for more information about this truly remarkable structure.
- Secondly, locate the center points on all the sides of all the triangles (Fig.1).
- Thirdly, draw perpendiculars from all the center points up to the point where other perpendiculars intersect them (see blue lines in Fig. 1).
- Lastly, erase all the sides of triangles. The leftover perpendiculars will act as the boundaries of the regions or area of influence.
From the above discussion, one can conclude that thiessen polygon method is a simple geometric technique to demarcate regions in an isotropic plain. Therefore, this method ignores the various geographic and geomorphic features which affect the regional boundaries. Hence, one should use this method with caution while understanding its limitations.

2.3. Isohyetal Method
Principle:
- This method uses contour lines (isohyets) of equal rainfall drawn over the region to compute the weighted average rainfall.
- It provides the most precise estimation, especially for non-uniform rainfall distribution.
Procedure:
- Plot the locations of rain gauge stations on a map.
- Draw isohyets (lines of equal rainfall) based on recorded values.
- Measure the area between two consecutive isohyets.
- Assign an average rainfall value to each area segment.
- Compute the weighted average rainfall.
Formula:
where,
= Average rainfall between two isohyets,
= Area between corresponding isohyets.
Advantages:
✔ Most accurate method, as it considers spatial rainfall variation.
✔ Suitable for hilly and large areas with non-uniform rainfall.
Limitations:
✖ Requires detailed contour maps and interpolation skills.
✖ More time-consuming compared to other methods.


The choice of method depends on the rainfall distribution and data availability:
- Arithmetic Mean Method for uniform rainfall.
- Thiessen Polygon Method for moderate variability.
- Isohyetal Method for highly non-uniform rainfall distribution.
3. Design of Rain Gauge Network
A rain gauge network should be designed to ensure accurate spatial and temporal rainfall measurement. Key considerations include:
- Spatial Distribution: Gauges should be distributed evenly across the area.
- Accessibility: Placement should allow easy maintenance and data collection.
- Elevation Variability: In hilly areas, gauges should be placed at different elevations.
- Land Use Considerations: Avoid areas with obstructions like buildings or dense forests.
4. Optimum Number of Rain Gauges as per IS 4987 - 1978
The optimum number of rain gauges in a region is essential for accurate rainfall measurement and hydrological analysis. The number of gauges should be sufficient to capture spatial variability while remaining cost-effective. The key steps in determining the optimum number of rain gauges are as follows:
The Indian Standard (IS 4987 - 1978) provides guidelines for determining the required number of rain gauges using the equation:
Where:
- = Optimum number of rain gauges
- = Coefficient of variation of rainfall
- = Acceptable error in mean rainfall estimation (usually 10%)
Higher variability in rainfall requires a greater number of rain gauges.
5. Intensity of Rainfall
Rainfall intensity is the rate at which rain falls over a specific time period, expressed as mm/hour. It is categorized as:
- Light Rain: < 2.5 mm/h
- Moderate Rain: 2.5 – 7.5 mm/h
- Heavy Rain: > 7.5 mm/h
It is used in hydrological modeling, drainage design, and flood prediction.
6. Mean Annual Rainfall
The mean annual rainfall is calculated as the average annual rainfall over a long period (typically 30-50 years) for a given location.
Where:
- = Annual rainfall for year
- = Number of years
This is crucial for climate analysis and water resource planning.
7. Estimation of Missing Rainfall Data
If data from a rain gauge is missing, it can be estimated using:
a) Simple Arithmetic Method:
If neighboring stations have similar rainfall, missing data is estimated using the average:
b) Normal Ratio Method:
Used when the normal annual precipitation of the missing station differs significantly from nearby stations.
Where:
- = Normal annual rainfall at missing station
- = Normal annual rainfall at neighboring stations
- = Recorded rainfall at neighboring stations
c) Inverse Distance Method:
Weights are assigned based on the inverse square of the distance between the missing station and the neighboring stations.
8. Presentation of Rainfall Data
Rainfall data is presented in various forms for analysis:
a) Tables:
Data is organized in tabular form with station names, dates, and recorded rainfall values.
b) Graphs:
- Hyetograph: A graph showing rainfall intensity vs. time, used for storm analysis.
- Mass Curve: Cumulative rainfall vs. time, used in reservoir design.
c) Maps:
- Isohyetal Maps: Contour maps showing spatial distribution of rainfall.
d) Statistical Analysis:
- Frequency analysis, probability distributions, and return period calculations help in flood and drought estimation.


Comments
Post a Comment